How does your incident rate stack up?
Understanding where your company stands is critical.
|
With NetworkASA just around the corner, it’s worth looking at statistics on workplace injuries and how your company might stack up against your peers across the country.
The American Supply Association’s Safety Committee has an increased number of applicants for its 2012 Safety Award. While greater participation makes for a better outcome, many companies may feel they’ve had an off year with a higher incident rate and do not believe their numbers will be good enough to measure up against the rest.
A review of the Occupational Safety and Health Administration’s latest statistics shows otherwise. According to 2011 figures (the most recently obtainable and the same calendar year used for ASA’s inaugural Safety Award in 2012), the incident rate for the wholesale industry was 2.7 per year, a rate only achieved by one participating company last year.
Nationally, among all private industries the average incident rate was 3.3. According to OSHA data, more than 2.8 million (94.8%) of the nearly 3 million nonfatal occupational injuries and illnesses in 2011 were injury-related. Among injuries, 2.1 million (75.2%) occurred in service-providing industries, which employed 82.5% of the private industry workforce covered by this survey. The remaining 700,000 injuries (24.8%) occurred in goods-producing industries, which accounted for 17.5% of private industry employment covered by this survey in 2011.
There were only two private industries that experienced increased rates: agriculture, forestry, fishing and hunting (5.2 incidents) along with the accommodation and food-service sector (3.7 incidents). The former is believed to be the result of increases in both crop and animal production. The latter is believed to be attributed to increases in recordable cases in both limited-service and full-service restaurants.
In addition, there were only two private industries that saw incidents decline in 2011: health care and social assistance (4.7) and retail trade (3.8).
It’s a similar story in the manufacturing sector. The national incident rate was 3.9, yet in categories similar to ASA membership, the numbers were even higher. Nonmetallic mineral product manufacturing was 5.0, primary metal manufacturing was at 5.6 and fabricated metal product manufacturing had an average of 5.9 incidents.
What should this information tell you? No matter how much effort we put in each day to lead to a safe environment, accidents can and will happen. Minimizing and learning from them are the most positive outcomes that can be achieved when incidents occur. Knowing where your company stacks up also can shed light on how it is doing with its safety record.
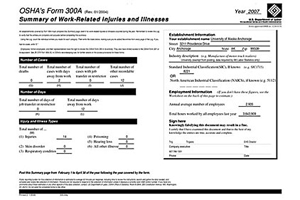
Thinking about applying for the Safety Award next year? Calculate what your Total Case Incident Rate is and see if your protocols in place are effectively keeping your people safe. Finally, don’t forget this is information your company already is required to provide to OSHA annually in your OSHA Form 300A. To do so, you’ll just need two pieces of information:
Total number of injuries (N);
Total number of hours worked (EH);
Multiply by 200,000
(N/EH) x 200,000
To learn more, go to Bureau of Labor Statistics –Workplace Injuries and Illness – 2011 at www.bls.gov/news.release/pdf/osh.pdf.
Dan Hilton is ASA’s Director of Government Affairs and staff liaison to the ASA Safety Committee. Hilton is based in Washington, D.C., and can be reached at 703/328-5234 or at dhilton@asa.net.
Looking for a reprint of this article?
From high-res PDFs to custom plaques, order your copy today!


