Driving Decisions Using Key Performance Trends
This year, ASA’s annual Operating Performance Report
turned 30 years old.
This year, ASA’s annual Operating Performance Report turned 30 years old. So much has happened in the industry over the past 30 years that, to some extent, PHCP and PVF distribution bears little resemblance to that of the early 1980s. Major consolidation has occurred in the industry, computerization is now commonplace and competition has proliferated, coming from many different directions both from within and outside the industry. This includes big-box retailers, such as Lowes and The Home Depot, which were fledging 30 years ago.
Also, over the past three decades, annual inflation has gone from double-digit levels to just over 2% per year; the economy has gone through four recessions, including major downturns in 1980-82 and 2008-2010; and there has been a collapse of the construction industry and housing market over the past five years. Simultaneously in recent years, businesses have experienced increased regulation and unprecedented uncertainty due to impending tax increases and other costs associated with financing national deficits, not the least of which is the new national healthcare legislation.
Through it all, industry wholesalers (or at least the survivors) have remained resilient and have found both new and old ways to survive and prosper. Since the ASA Operating Performance Report has now turned 30, we have a 30-year prism to view and assess where the industry has been and where it is today from a financial perspective.
A striking development in the industry over the past 30 years is that both gross margin as a percent of sales, and operating profit (i.e., operating margins) as a percent of sales have shrunk significantly (as shown in Exhibit 1). In fact, for today’s typical ASA OPR participant, due to the combined impact of lower gross margins and higher expenses, operating profits are negative. (Note: for purposes of the ASA OPR study, vendor rebates and cash discounts on purchases are not included in gross margin. These income items are considered as part of nonoperating income).
While the double negative of lower gross margins and higher expenses have led to operational losses, bottom line profitability for the typical industry company has been maintained in recent years to levels similar to that of 30 years ago because vendor rebates have increased substantially over the years (from 0.4% of sales 30 years ago to 3.9% today (Exhibit 2). In other words, if it were not for vendor rebates, the typical ASA OPR participant would operate at a loss.
Interestingly, even though today’s computer capabilities provide inventory management information and excess inventory warning signals that were not possible 30 years ago, the fact is inventory productivity today is virtually unchanged from the early 1980s. As shown in Exhibit 2, both inventory turnover and GMROI are virtually the same today as 30 years ago.
Expense management is key
Without question, the number one criterion for success in the industry is “expense management.” Year in and year out, consistently and virtually without exception, the high profit group of companies has lower total operating expenses as a percent of sales than other industry firms. This does not mean to imply that the high performers simply unilaterally cut expenses to be profitable (Obviously, such a short-term oriented strategy would do more harm than good over the long haul). Rather, the name of the game for the high performers is to find ways to be more effective and efficient, thus lowering costs.
Sales growth is important, but not the only game in town
While most of the time the high profit group of companies do in fact have higher sales growth than other industry firms, this certainly is not always the case. When companies do everything possible to grow the “top” line of their business (such as expanding infrastructure, hiring salespeople, stocking up on inventory, etc.), but ignore the “bottom line,” trouble lurks. In such cases, when a downturn occurs guess what hits the fan?
Personnel management is always a key component for success
For the typical PHCP and PVF wholesaler, payroll and fringe benefits cost well over 60% of gross margin. As a result, it makes sense that effectively managing personnel would be a critical component of high profitability. In fact, this has proven consistently true over the past thirty years, as the High Profit Group of companies almost always, have lower payroll costs (as a percent of sales and gross margin), coupled with higher sales and gross margin per employee.
Following the “basics” of Accounts Receivables management is always important
Interestingly, effective management of accounts receivable (as measured by the ratio “average collection period in days on receivables”) is not necessarily a success factor that differentiates the High Profit Group of companies from other industry firms. That is, in some years the High Profit Group has lower receivables days outstanding than other companies, while in other years the High Profit companies take somewhat longer to collect receivables. The reason for this seeming inconsistency is that the “basics” of good receivables management (such as: effectively screening new customers, measuring days outstanding and aging schedules, and following up aggressively when a customer falls behind on payments) are well-known and widely followed by most companies. It is only the really remiss companies that do not follow these basics and get into trouble, which hits especially hard during economic downturns.
Gross margins are not necessarily important, but the combination of gross margin, inventory Turnover, and the Resulting GMROI is Key
While, over the past 30 years, the high profit group of companies usually have somewhat “lower” gross margins as a percent of sales than other industry firms, this is usually offset by somewhat higher inventory turns and a somewhat higher GMROI (i.e., Gross Margin Return on Inventory). Summary and Conclusions In summary, while there have been dramatic changes in the industry, the bottom line is that success typically comes from following the basics of business and focusing on the four or five areas of the business identified above that result in the most significant profitability impact. Moreover, high profitability does not necessarily mean being significantly superior in all of these areas. Rather, the cumulative impact of being even somewhat better in most or all of these areas results in substantially higher profitability.
As we look to the next 30 years, remember those who do not learn from history are condemned to repeat it. Fortunately, we have a 30-year history of the OPR to learn what leads to success in the industry.
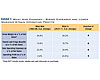
Exhibit 1
This year, ASA’s annual Operating Performance Report turned 30 years old. So much has happened in the industry over the past 30 years that, to some extent, PHCP and PVF distribution bears little resemblance to that of the early 1980s. Major consolidation has occurred in the industry, computerization is now commonplace and competition has proliferated, coming from many different directions both from within and outside the industry. This includes big-box retailers, such as Lowes and The Home Depot, which were fledging 30 years ago.
Also, over the past three decades, annual inflation has gone from double-digit levels to just over 2% per year; the economy has gone through four recessions, including major downturns in 1980-82 and 2008-2010; and there has been a collapse of the construction industry and housing market over the past five years. Simultaneously in recent years, businesses have experienced increased regulation and unprecedented uncertainty due to impending tax increases and other costs associated with financing national deficits, not the least of which is the new national healthcare legislation.
Through it all, industry wholesalers (or at least the survivors) have remained resilient and have found both new and old ways to survive and prosper. Since the ASA Operating Performance Report has now turned 30, we have a 30-year prism to view and assess where the industry has been and where it is today from a financial perspective.
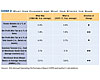
Exhibit 2
Liars may figure, but figures do not lie
Shown are two simple exhibits that illustrate what has changed and what remains the same. In each exhibit, the first column shows performance for the typical ASA OPR respondent for key measures 30 years ago (i.e., the good old days); the second column shows what’s happening today (i.e., reality).A striking development in the industry over the past 30 years is that both gross margin as a percent of sales, and operating profit (i.e., operating margins) as a percent of sales have shrunk significantly (as shown in Exhibit 1). In fact, for today’s typical ASA OPR participant, due to the combined impact of lower gross margins and higher expenses, operating profits are negative. (Note: for purposes of the ASA OPR study, vendor rebates and cash discounts on purchases are not included in gross margin. These income items are considered as part of nonoperating income).
While the double negative of lower gross margins and higher expenses have led to operational losses, bottom line profitability for the typical industry company has been maintained in recent years to levels similar to that of 30 years ago because vendor rebates have increased substantially over the years (from 0.4% of sales 30 years ago to 3.9% today (Exhibit 2). In other words, if it were not for vendor rebates, the typical ASA OPR participant would operate at a loss.
Interestingly, even though today’s computer capabilities provide inventory management information and excess inventory warning signals that were not possible 30 years ago, the fact is inventory productivity today is virtually unchanged from the early 1980s. As shown in Exhibit 2, both inventory turnover and GMROI are virtually the same today as 30 years ago.
The Criteria for High Profitability Have Not Changed
While the competitive climate, as well as some of the basic economics of operating as a PHCP and PVF distributor may have changed, the fact is for 30 years the components for success in the industry remain largely unchanged. Each year’s OPR includes a special analysis that compares the performance of the most profitable, or industry winners, (defined as the upper 50% best performing companies based on the measure before tax return on assets) vs. other companies in the industry. Year in and year out, the same components for success prove to be true.Expense management is key
Without question, the number one criterion for success in the industry is “expense management.” Year in and year out, consistently and virtually without exception, the high profit group of companies has lower total operating expenses as a percent of sales than other industry firms. This does not mean to imply that the high performers simply unilaterally cut expenses to be profitable (Obviously, such a short-term oriented strategy would do more harm than good over the long haul). Rather, the name of the game for the high performers is to find ways to be more effective and efficient, thus lowering costs.
Sales growth is important, but not the only game in town
While most of the time the high profit group of companies do in fact have higher sales growth than other industry firms, this certainly is not always the case. When companies do everything possible to grow the “top” line of their business (such as expanding infrastructure, hiring salespeople, stocking up on inventory, etc.), but ignore the “bottom line,” trouble lurks. In such cases, when a downturn occurs guess what hits the fan?
Personnel management is always a key component for success
For the typical PHCP and PVF wholesaler, payroll and fringe benefits cost well over 60% of gross margin. As a result, it makes sense that effectively managing personnel would be a critical component of high profitability. In fact, this has proven consistently true over the past thirty years, as the High Profit Group of companies almost always, have lower payroll costs (as a percent of sales and gross margin), coupled with higher sales and gross margin per employee.
Following the “basics” of Accounts Receivables management is always important
Interestingly, effective management of accounts receivable (as measured by the ratio “average collection period in days on receivables”) is not necessarily a success factor that differentiates the High Profit Group of companies from other industry firms. That is, in some years the High Profit Group has lower receivables days outstanding than other companies, while in other years the High Profit companies take somewhat longer to collect receivables. The reason for this seeming inconsistency is that the “basics” of good receivables management (such as: effectively screening new customers, measuring days outstanding and aging schedules, and following up aggressively when a customer falls behind on payments) are well-known and widely followed by most companies. It is only the really remiss companies that do not follow these basics and get into trouble, which hits especially hard during economic downturns.
Gross margins are not necessarily important, but the combination of gross margin, inventory Turnover, and the Resulting GMROI is Key
While, over the past 30 years, the high profit group of companies usually have somewhat “lower” gross margins as a percent of sales than other industry firms, this is usually offset by somewhat higher inventory turns and a somewhat higher GMROI (i.e., Gross Margin Return on Inventory). Summary and Conclusions In summary, while there have been dramatic changes in the industry, the bottom line is that success typically comes from following the basics of business and focusing on the four or five areas of the business identified above that result in the most significant profitability impact. Moreover, high profitability does not necessarily mean being significantly superior in all of these areas. Rather, the cumulative impact of being even somewhat better in most or all of these areas results in substantially higher profitability.
As we look to the next 30 years, remember those who do not learn from history are condemned to repeat it. Fortunately, we have a 30-year history of the OPR to learn what leads to success in the industry.
Links
Looking for a reprint of this article?
From high-res PDFs to custom plaques, order your copy today!


