February construction starts descend 3%
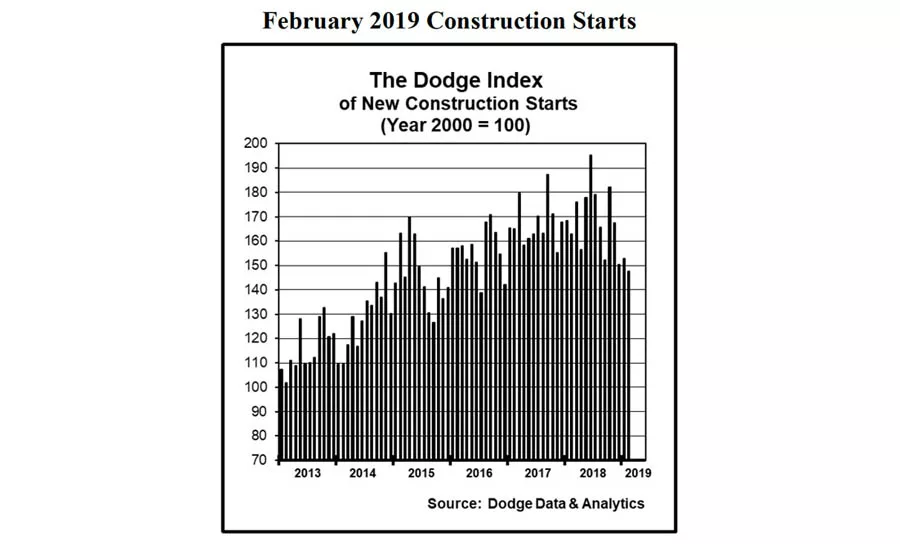
February 2019 Construction Starts. Image courtesy of The Dodge Date & Analytics
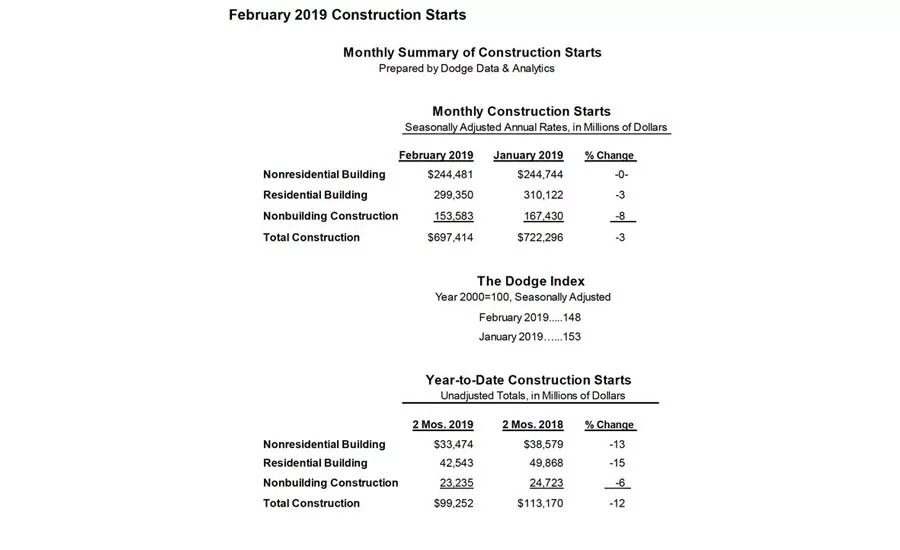
Monthly summary of construction starts. Image courtesy of The Dodge Date & Analytics
At a seasonally adjusted annual rate of $697.4 billion, new construction starts in February dropped 3% from the previous month, according to Dodge Data & Analytics.
The February decline returned construction starts to the downward path that emerged during the closing months of 2018. Two of the three main construction sectors registered weaker activity in February – nonbuilding construction fell 8%, due to a pullback by its public works segment, while residential building slipped 3%.
Meanwhile, nonresidential building in February was able to hold steady with its January pace. During the first two months of 2019, total construction starts on an unadjusted basis were $99.3 billion, down 12% from the same period a year ago which had been lifted by the start of the $2.0 billion NEXUS natural gas pipeline in Ohio and Michigan and the $1.3 billion domed NFL stadium in Las Vegas, Nevada. On a twelve-month moving total basis, total construction starts for the twelve months ending February 2019 were able to remain essentially even with the corresponding amount for the twelve months ending February 2018.
The February statistics produced a reading of 148 for the Dodge Index (2000=100), compared to 153 for January. The 150 average for the Dodge Index during the first two months of 2019 was the same as the 150 reading in December, which was at the low end of last year’s range of activity.
“The pace of construction starts has been lackluster in early 2019,” stated Robert A. Murray, chief economist for Dodge Data & Analytics. “The public works sector has retreated, likely affected by harsh winter weather conditions and the fact that fiscal 2019 federal appropriations for several programs were not finalized until mid-February. With funding levels now set, including a 2% increase for the federal-aid highway program, it’s expected that public works will show improvement in coming months. For residential building, single family housing remains sluggish, as affordability constraints continue to dampen demand even as mortgage rates have settled back, while a more cautious lending stance by banks may now be starting to restrain multifamily development. Nonresidential building so far in 2019 has not yet seen the same magnitude of very large projects that reached groundbreaking during 2018. At the same time, market fundamentals for warehouses and office buildings remain supportive for construction, and the large amount of funding coming from state bond measures passed in recent years should contribute to healthy levels of construction activity for such institutional project types as school construction.”
Nonbuilding construction
Nonbuilding construction in February was $153.6 billion (annual rate), down 8% from January. The public works categories as a group dropped 15%, retreating for the second month in a row, while the electric utility/gas plant category climbed 34%. Highway and bridge construction fell 7% after a 2% decline in January, and February’s activity was down 12% from the average monthly pace during 2018. Large highway projects that reached groundbreaking in February were a $185 million highway expansion in Phoenix, Arizona and a $178 million highway expansion in San Antonio, Texas. The miscellaneous public works category, which includes such diverse project types as pipelines and rail transit projects, plunged 49% in February after soaring 114% over the previous two months, with January lifted by the start of the $1.0 billion Midship natural gas pipeline in Oklahoma. By contrast, the largest miscellaneous public works project entered as a February construction start was a $127 million natural gas pipeline in New Jersey. Sewer construction in February retreated 8%, despite the start of a $267 million waste water treatment plant expansion in the Honolulu, Hawaii area. The remaining two public works project types registered gains in February, with river/harbor development up 25% and water supply construction up 11%. The 34% jump for the electric utility/gas plant category in February reflected the start of two large natural gas-fired power plants, a $1.0 billion plant in Saint Clair, Michigan and a $937 million plant in Willis, Texas, plus the start of a $375 million solar power plant in the Valdosta, Georgia area.
Residential building
Residential building in February was $299.3 billion (annual rate), down 3% as both sides of the housing market showed decreased activity. Multifamily housing fell 7%, retreating after its 17% rebound in January. Despite the decline, there were still six multifamily projects valued at $100 million of more that reached groundbreaking in February. These were led by two projects in the Long Island City area of the New York, New York metropolitan area – the $500 million North Tower and the $200 million South Tower at the Hunters Point South apartment complex. The next largest multifamily projects were the $154 million multifamily portion of the $170 million Archer Green mixed-use complex in the Jamaica Queens area of New York, New York and the $144 million multifamily portion of the $240 million Hoffman Town Center project (blocks 4 and 5) in Alexandria, Virginia. The top five metropolitan areas ranked by the dollar amount of multifamily starts in February were – New York, New York; Washington DC, Dallas-Ft. Worth, Texas; Miami, Florida and San Francisco, California. During the first two months of 2019, the New York, New York metropolitan area comprised 18% of the multifamily dollar amount for the U.S., up from the 16% share for the full year 2018, although not as high as the 24% share that was reported for the full year 2015. Single family housing in February receded 2% from January, continuing the modest slippage that emerged during last year’s fourth quarter. By geography, single family housing performed as follows in February relative to January – the West, down 5%; the South Central, down 2%; the South Atlantic, down 1%; the Midwest, unchanged; and the Northeast, up 7%.
Nonresidential building
Nonresidential building in February was $244.5 billion (annual rate), basically the same as January’s volume. The commercial building categories as a group rose 2%, which followed a 4% gain in January. Warehouse construction surged 33% in February, led by a $200 million Amazon distribution facility in Oak Creek, Wisconsin, an $85 million Costco distribution center in Katy, Texas, and a $70 million Goodyear Tire distribution center in Forney, Texas. Hotel construction climbed 22%, reflecting the start of the $372 million hotel portion of the $500 million Circa Resort and Casino in Las Vegas, Nevada. Store construction improved 11%, helped by the start of the $64 million Macy’s Men’s Store redevelopment in San Francisco, California, and the commercial garage category grew 3%. Office construction was the one commercial project type to report a February decline, falling 21% after its 18% hike in January that featured such projects as the $550 million Reston Gateway office complex in Reston, Virginia, and the $350 million Hines office tower in Houston, Texas. Even with the decline, there were still noteworthy office projects that were entered as February starts, such as the $375 million Block 185 redevelopment in Austin, Texas, and the $100 million Cannon House office renovation in Washington DC. There were also several large data center projects (included in the office category) that reached groundbreaking in February, led by a $175 million Google data center expansion in Moncks Corner, South Carolina, and two data centers in Ashburn, Virginia, valued at $120 million each.
The institutional side of nonresidential building was unchanged in February after the 2% decline reported in January. The healthcare facilities category had a strong February, increasing 26% with the lift coming from such projects as the $265 million expansion to the Children’s Hospital of Wisconsin in Wauwatosa, Wisconsin and the $176 million Colorado Center for Personalized Medicine in Aurora, Colorado. Educational facilities in February advanced 6%, led by the $200 million renovation of a healthcare research facility at the University of Pittsburgh in Pittsburgh, Pennsylvania, a $96 million engineering building at the University of Texas in Austin, Texas, plus large high school projects in Millersville, Pennsylvania ($87 million), Hammond, Indiana ($78 million), Wentzville, Missouri ($76 million), and Wimauma, Florida ($76 million). On the negative side, the public buildings category plunged 45% after its 59% jump in January that included the $525 million Utah State Prison relocation in Salt Lake City UT. Decreased construction starts were also reported in February for transportation terminal projects, down 35%; church construction, down 23%; and amusement-related work, down 7%. The manufacturing plant category dropped 14% in February after a 13% January gain, although the latest month did include the start of a $135 million lumber production facility in Albany, Georgia and a $105 million window manufacturing plant in Goodyear, Arizona.
The 12% shortfall for total construction starts on an unadjusted basis during the first two months of 2019 compared to last year was the result of lower activity for each of the three main sectors. Residential building fell 15% year-to-date, with single family housing down 13% and multifamily housing down 17%. Nonresidential building dropped 13% year-to-date, with commercial building down 5%, institutional building down 18%, and manufacturing building down 29%. Nonbuilding construction retreated 6% year-to-date, as a 17% decline for public works was partially offset by a 116% surge for the electric utility/gas plant category after a very weak first two months of 2018. By geography, total construction starts for the first two months of 2019 versus the same period a year ago performed as follows – the Midwest, down 24%; the Northeast, down 15%; the South Central, down 10%; the South Atlantic, down 9%; and the West, down 8%.
Additional insight is provided by looking at twelve-month moving totals, in this case the twelve months ending February 2019 versus the twelve months ending February 2018, which offers less volatility than is present with year-to-date comparisons of just two months. On this basis, total construction starts for the most recent twelve months essentially matched the amount of the previous period. By major sector, residential building grew 2%, with 2% gains for both single family and multifamily housing. Nonresidential building was unchanged from the previous period, with manufacturing building up 21%, commercial building up 2%, and institutional building down 5%. Nonbuilding construction dropped 4%, with public works down 2% and electric utilities/gas plants down 16%. By geography, total construction starts showed this pattern for the most recent twelve months compared to the previous period – the South Central, up 9%; the West, up 3%; the Midwest and South Atlantic, each unchanged; and the Northeast, down 15%.
Looking for a reprint of this article?
From high-res PDFs to custom plaques, order your copy today!


