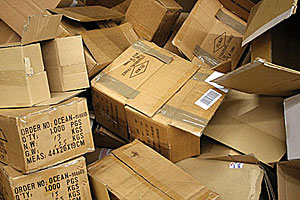
Seemingly dead inventory can still produce revenue
Don’t liquidate it.
In the face of new types of competitors (e.g., Amazon Supply), PHCP and HVAC supply distributors should stop the habitual practice of liquidating slow-moving and “dead” inventory into cash.
Instead, try to develop a long-term plan to cost-effectively market the potentially profitable products. Distributors who do not want to develop such a plan need to be aware that the traditional definition of slow-moving and dead stock (“velocity”) is not accurate. It can result in discarding products that are profitable and can make the distributorship more appealing to customers.
As competitors such as Google Shopping for Suppliers acquire more customers that buy the faster-moving commodity products, price competition will further reduce margins. Slower-moving products will have to account for more gross-margin dollars. New, fee-based value-added services could bring in more revenue, but services are not the subject of this article.
|
Remember that most of the slow/no movers were initially purchased because there was demand or someone thought there would be demand. Some slow/no moving products are customers’ returns of “nonreturnable” items and some resulted from high minimum purchase quantities. Even if there was no new competition, some of today’s fast-movers will be tomorrow’s slow-movers. This is why a long-term plan is needed.
Movement vs. profitability
Traditionally, some distributors have been making decisions to liquidate inventory based on movement or “velocity,” which is not a strategic measure. The prevalent measure of movement is sometimes termed the ABC classification and involves identifying those stock products that account for the top X% of cost of goods sold — “A” items, then the next X% “B” items, etc.
The value of X is user-set usually at 20. Often, under the ABC method, at least 60% of stocked products are considered “slow” and 20% are considered “dead” (especially products sold to one customer who no longer buys them). Two other methods of classifying product movement uses “hits” (number of times sold) or “units” (number of pieces sold) in a period instead of COGS.
None of these measurements reflect the gross or net profitability of a product, measures that some distributors do use for decisions about liquidating. Gross margin percentage, which is computer-calculated, can reveal some very fast-movers are not very profitable, while some slowpokes are more than earning their keep. Net profitability can be defined as the dollar gross margin of a product less the cost of servicing that product. It is calculated by only some ERP systems.
However, there is much debate among PHCP, HVAC and PVF distributors about what constitutes cost of service. Even where there is agreement, it is difficult to measure some of the costs (e.g., extra cost of handling large products such as fiberglass tub-shower units).
Even gross and net profitability are not the measure that some distributors use when deciding which products to stop stocking — gross margin return on inventory-investment. GMROI is a strategic measure and is computer-calculated by dividing a product’s dollar gross margin during a period by the average value of its inventory during that period. GMROI can be compared to the return on other investments made by the distributorship, such as the purchase of a delivery truck.
As with profitability, a GMROI analysis can show that some slow-movers are worth keeping and some fast-movers are not. Some distributors argue that financially slow-movers should be kept because they are needed to offer a “full line” to customers. Be careful of the slippery slope of “full line,” which can result in far too many financially low products being stocked for far too long.
Long-range plan
Here is an outline of some things to consider while developing a long-range plan to market the financially slow-moving and dead products.
- Decide what the minimum acceptable GMROI for stocked products should be and what the minimum dollar margin/unit should be.
- Calculate the GMROI for every product stocked and identify those that have not been earning enough return. For those products that also have had insufficient dollar margin/unit, and for which a price increase would not be substantially helpful, start liquidating. Watch out for historical data with abnormalities in it, because it can make winners look like losers.
- Examine the history of prior sales of these products that will not be liquidated for clues about who might buy them now.
- Determine if there are new types of customers who could buy them.
- Consider increasing the price of each laggard.
- Be aware of new types of competition and what they are selling or likely to sell.
- Investigate advertising, which might be cost-effective for families of similar slow-moving products.
- Use the company’s website to promote them, and enable registered viewers to browse through data for them and place orders.
- If it is necessary to establish relationships with other types of distributors to sell them, investigate such arrangements.
- Where applicable, for each tactic, estimate needed investments, ongoing expenses and costs, revenues, risks and intangible benefits. Perform a long-term cost-benefit analysis.
- Identify those products under analysis for which parameters might need to be changed (service level, safety stock, EOQ, min/max).
Non-stock products and how they have sold is loosely related to stocked slow-movers.
Analyze non-stock sales and determine which should be stocked, not because they likely would be frequent sellers, but would likely sell with an acceptable GMROI and appeal to current and potential customers. Avoid commodities and also consider non-stocks that have not been sold, but are in the same family as the non-stocks that have sold and would be stocked.
Marketing the slow-moving and dead products may work so well that the quantity stocked would be increased.
HELPFUL LINKS:
Looking for a reprint of this article?
From high-res PDFs to custom plaques, order your copy today!


