AGC's Construction Inflation Alert
Contractors, project owners, budgeting and planning officials, and reporters often ask AGC why construction costs in the past two years seem to be rising so much faster than the general rate of inflation, or whether the disparity is real. This paper compares two common inflation measures, the consumer price index for all urban consumers (CPI-U) and the producer price index (PPI) for finished goods, against a variety of PPIs for construction materials and groupings of materials. Data are presented yearly for a nearly five-year period: years ending in December 2001, 2002, and 2003, and the two most recent 12-month periods, ending in September 2004 and September 2005. All figures are percentage changes from the same month one year earlier, as calculated by the Bureau of Labor Statistics ( www.bls.gov/cpi for the CPI-U and www.bls.gov/ppi for all other indexes).
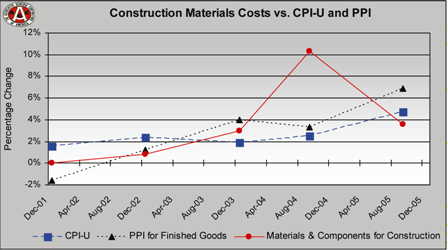
Construction materials rise while consumer prices remain moderate.
In general, consumer prices have remained very moderate through the entire period, although they have accelerated in the past two years as oil prices have set new records. The PPI for finished goods, the broadest measure of prices received by sellers to final business or consumer customers, has also been “well-behaved” throughout the period, but with more of an upturn.
The data available so far do not reflect the impact of Hurricane Rita, and only partial impact from Katrina, on producer prices. Both storms struck especially hard at the supply of construction inputs ranging from diesel fuel to plastics to cement. As of late October, the majority of Gulf of Mexico crude oil and natural gas production was still shut in, virtually assuring that construction materials that use oil or natural gas as a feedstock would be much higher-priced, at least through the winter heating season, than if the storms had not occurred. Katrina also interfered with imports of cement and natural rubber, and the hurricane damaged plants that produce gypsum, lumber and plywood, and liquid hydrogen for galvanizing steel. Chart 1 shows that there was, on average, no change in costs for construction materials and components in the recession year of 2001 and an increase of less than one percent in 2002. Costs rose during 2003 but still remained below the rise in the overall PPI. In general, these increases were not anticipated by either contractors or owners. Owners, in particular, may have been expecting construction cost increases to remain in the three percent range of overall consumer and producer prices.

Costs diverge among construction types.
In the last 12 months, lumber and plywood prices have dropped sharply. This decline has slowed the growth of costs for single-family homebuilding and improvements, which together account for about 50 percent of total construction. The drop has been steep enough to make it appear that construction materials costs in general are no longer rising as fast as either the CPI or the finished-goods PPI.However, wood products are not a significant part of the materials cost for nonresidential construction, which has continued to experience larger cost increases than the overall CPI and PPI, as shown in Chart 2.
Between 2001 and 2003, costs for all types of construction behaved similarly. But the run-ups in steel, petroleum, and cement prices in the
first half of 2004 made a bigger difference for nonresidential and multi-family construction than for single-family, which relies less heavily on these inputs. In the latest 12 months, the further increases in cement, diesel fuel, and asphalt prices particularly affected highway and street construction. Other heavy construction, nonresidential building, and multi-unit residential construction experienced some deceleration in costs as steel prices fell in recent months. Single-family residential construction benefited from the sharp fall in wood products prices, and recently from falling steel prices.

Major construction materials all show price spikes in 2004-2005.
Appendix Table 3 explain several aspects of the construction price spikes. First, most prices either declined or experienced very modest increases in 2001-03. Consequently, many contractors and owners were making little or no provision for price increases in 2004.Second, many prices exploded in the 12 months through September 2004: steel and copper/brass products for construction (19 to 62 percent higher), gypsum products (21 percent), asphalt and lumber/plywood (12 percent each), and insulation materials (11 percent).
Nearly every other index rose more rapidly than in the previous three years. One business that was hit especially hard was metal fabrication. Metal fabricators that had contracted to provide products at fixed prices were squeezed by scrap surcharges and base-price hikes from mills. Some fabricators declared bankruptcy, and many stopped guaranteeing prices beyond a short period.
Third, contractors were affected in two ways in 2004 by higher diesel prices. Whereas the increases in 2002 and 2003 had roughly offset the decrease of 2001, prices set new records in 2004. That directly affected contractors for which fuel costs were significant, such as earthmovers, highway contractors and dump truck operators. In addition, the trucking market tightened significantly, partly in response to new hours-of-service rules for truck drivers that lengthened delivery times in some cases, and partly because a robust economy created strong demand for trucking services. Trucking companies passed along higher fuel and wage costs in the form of fuel surcharges and base delivery charges.
Fourth, in the latest 12 months, prices of inputs have diverged sharply. Prices for lumber/plywood and some steel products have declined, and other steel prices have slowed to three to four percent increases. But price increases for asphalt jumped from 12 percent to 15 percent and concrete products went from seven percent to 10 percent. The increases for diesel fuel, copper/brass mill shapes, and gypsum products slowed but remained very elevated, at 51 percent, 19 percent, and 13 percent, respectively. Equipment prices rose seven percent at the producer level; higher delivery charges and the expiration of a tax break for equipment placed in service after 2004 have made the effective cost for contractors even higher.
These diverse price changes mean greater variance among both bids and actual costs, depending on the mix of materials and when they were specified or bought, equipment intensity and age, and contractors' willingness or ability to include cost-sharing mechanisms or contingencies for future price increases.
Broad input prices point to higher construction costs ahead.
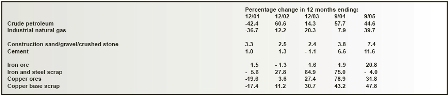
Future cost increases are always unpredictable, but some clues can be found by looking at indexes for basic inputs, such as those shown in Appendix Table 4, that are important to construction.The connection between the prices of several widely used inputs and intermediate or finished goods prices varies by material and specific market conditions. At a time when demand for construction materials is strong and many domestic producers are operating at capacity, cost increases at the raw materials stage are more likely to be passed on, particularly if one or two materials are major portions of the cost of the construction input.
For example, concrete consists of cement, sand, gravel or crushed stone, and water, plus significant amounts of energy and fuel to mix and transport the ingredients. Construction plastics, which are made from either industrial natural gas or crude oil (as feedstock and fuel), and copper/brass mill shapes, from copper ores or scrap, also seem fated to experience further steep price increases, based on recent crude-materials prices.
But the outlook for steel, some of which is from “mini-mills” that melt down scrap and some of which is from basic oxygen furnaces that combine iron ore, coke, and other ingredients, is less certain. Scrap prices have fallen in the past 12 months, while iron-ore prices have risen steeply. Furthermore, steel prices vary with the balance of worldwide supply and demand. That balance has fluctuated as demand has grown in China, India, and other industrializing countries, while China has also opened many steel mills.
Conclusion
Many key categories such as diesel fuel, gypsum products, and copper and brass have seen double-digit price increases in both 2004 and 2005. The global building boom strained supplies of key construction components and may continue to produce large increases in demand for a wide variety of building components in the future. Conditions such as hurricanes and regulations on trucking also impact construction activities. The leveling off of prices for wood products has kept single-family residential construction inflation well below that of commercial construction and highway construction.
AGC believes that this information is critical to successful owners and contractors. Therefore, AGC will continue to use a wide variety of key indicators to analyze trends that will help keep its members consistently
ahead of the curve.
For a full copy of Simonson's Construction Inflation Alert, click here www.agc.org/galleries/pr/FinalAGCCIA.pdf . The Associated General Contractors of America (AGC) is a national construction trade association based in the United States that represents more than 32,000 firms, including 7,000 of America's leading general contractors, and over 11,000 specialty-contracting firms. More than 13,000 service providers and suppliers are associated with AGC through a nationwide network of chapters. Visit the AGC Web site at www.agc.org .
Looking for a reprint of this article?
From high-res PDFs to custom plaques, order your copy today!


