Is There a Recovery Out There?
The answer is yes. A resounding YES!
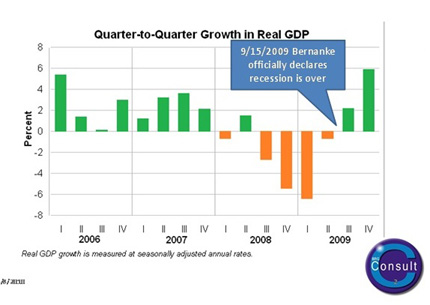 On September
15, 2009, Ben Bernanke, Chairman of the U.S. Federal Reserve, announced this
long recession was officially over. People scoffed. Unemployment in September
was at 9.8% - the highest it had been since the great recession began. Even
worse, approximately one-third of the unemployed had now been without a job for
27 weeks or more.
On September
15, 2009, Ben Bernanke, Chairman of the U.S. Federal Reserve, announced this
long recession was officially over. People scoffed. Unemployment in September
was at 9.8% - the highest it had been since the great recession began. Even
worse, approximately one-third of the unemployed had now been without a job for
27 weeks or more.
Was Bernanke right in his statement? Did he see things that the general population did not? The answer is yes, and yes with GUSTO!
In 2009 the U.S. economy retracted by 2.5%. However the economy started rebounding in the second quarter of 2009 and leaped into positive territory in the 3rd and 4th quarters of the year. In fact, 4th quarter growth was an exuberant 5.9%. This is the type of growth typically associated with boom year economies.
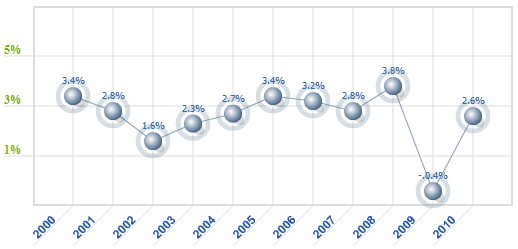 Inflation
is up for this year - there is no denying this. However, as the following chart
shows, the Feds have done a good job keeping inflation from running out of
control. The reason we perceive inflation on the rise - and it is - is because
in 2009 the U.S. economy actually had a minor case of deflation with the annual
rate of inflation being pegged at -0.4%.
Inflation
is up for this year - there is no denying this. However, as the following chart
shows, the Feds have done a good job keeping inflation from running out of
control. The reason we perceive inflation on the rise - and it is - is because
in 2009 the U.S. economy actually had a minor case of deflation with the annual
rate of inflation being pegged at -0.4%.
As 2009 came to an end, all eyes were focused on consumer spending. With unemployment hovering at 10.2%, the economists were concerned.
“Black Friday,” one of the biggest shopping days during the Christmas season, saw an average 8.6% decline over 2008. The economists sounded the warning bells and ran for the hills!
By the end of December, a Commerce Department report showed spending by individuals fell 1%. December marked the 6th straight month in which consumers cut back on their spending, a decline that accelerated dramatically in the last three months. For the 4th quarter, spending fell a record 8.9% - the worst quarter for spending since the Commerce Department began tracking that statistic in 1947.
Spending for the full year rose just 3.6%, the lowest increase in 47 years.
On another note, by the end of the year distributors had reduced their inventories by 25% compared to the year prior.
Before the New Year set in, we all asked ourselves, “Is there a recovery out there?” A new question now has started to make the rounds: “Is this recovery sustainable?”
 At the beginning of the new decade questions
surfaced that sounded like we were talking about alphabet soup. “Would it be a
V, W or U?” The talking heads thought a V (vigorous rebound and growth) would be
unlikely, a W a strong possibility (a strong rebound, but then falling back
into a recession shortly thereafter). Most feared that any recovery, if there
was one, would sputter and the economy would enter into a prolonged period of
stagnant growth - the dreaded U-recovery. Was this the beginning of a lost decade,
similar to the Japanese lost decade that started in the early 1990s and lasted
for over 10 years?
At the beginning of the new decade questions
surfaced that sounded like we were talking about alphabet soup. “Would it be a
V, W or U?” The talking heads thought a V (vigorous rebound and growth) would be
unlikely, a W a strong possibility (a strong rebound, but then falling back
into a recession shortly thereafter). Most feared that any recovery, if there
was one, would sputter and the economy would enter into a prolonged period of
stagnant growth - the dreaded U-recovery. Was this the beginning of a lost decade,
similar to the Japanese lost decade that started in the early 1990s and lasted
for over 10 years?
At the end of 2009 the U.S. expenditure for construction was down 9.3%. Private residential construction was down 6.4% and private commercial construction was down 19.9%. Public construction, however, went up 2.1% with public housing up 9% over the previous year. This was our stimulus money at work.
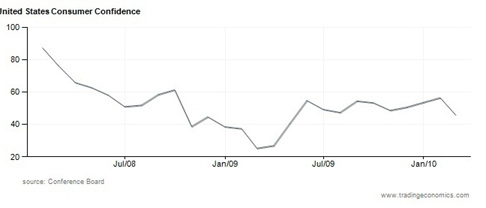
The U.S. economy was battered and bruised. At BRG we started to see a clearer picture of how the rebound was shaping up. Companies had started rebuilding. Production for inventory actually started increasing around March 2009 and by December there had been nine consecutive months of inventory buildup. In January, consumer spending on durable goods increased 0.8%.
By February, the momentum increased. Sales of durable goods to inventory were again up - the 11th consecutive month of gains. But as can be seen from the following graph, consumers' short-term outlook took a turn for the worse, with fewer consumers anticipating an improvement in business conditions and the job market over the next six months. The unemployment rate had retracted but still hovered around 9.7%.
 February 2010 will long be remembered for extreme weather from Canada to the 48
continental U.S. states. Blizzards
swept across the country and dumped historic snowfalls that shut down the U.S.
government, the United Nations in New York and paralyzed airports across the
nation. Downtown Washington, normally busy with bureaucrats, resembled a ghost
town as several hundred thousand people stayed home.
February 2010 will long be remembered for extreme weather from Canada to the 48
continental U.S. states. Blizzards
swept across the country and dumped historic snowfalls that shut down the U.S.
government, the United Nations in New York and paralyzed airports across the
nation. Downtown Washington, normally busy with bureaucrats, resembled a ghost
town as several hundred thousand people stayed home.
Even the most robust consumer enthusiasm gets shut down when Mother Nature puts on that kind of deep chill.
But the sun rose again and the snow plows dug out the nation. In early March the U.S. Department of Commerce released encouraging information concerning the U.S. construction market. Building permits were at 621,000 - 4.9% down from the December 2009 rate of 653,000 but 16.9% above the January 2009 estimate of 531,000.
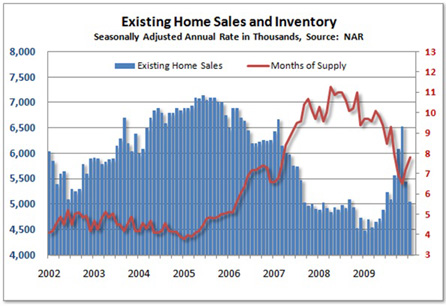
Housing starts also showed encouraging figures. At 591,000 starts, this was 2.8% above the December 2009 number of 575,000 and 21.1% above the January 2009 estimates. According to the National Association of Realtors, sales of existing homes were up 7% nationwide if compared to last January. The largest growth was recorded in the Northeast (+17.1%), followed by the South (+8%), the Midwest (+3.8%) and the West (+2.7%).
Even more exciting, the inventory of existing homes has decreased 9.6% over last January’s level and now represents approximately 7.8 months of inventory. Six months’ worth is considered normal. This is significantly below the 10-month inventory we saw at the peak of the recession in 2008. BRG believes there will be a spike of homes sold in the next few months, especially among first-time home owners as the special tax incentive for first-time home owners will expire in April 2010.
As the following chart clearly shows, existing home sales and the months of supply are both moving in the right direction - another sign that the recovery is underway.
Another key economic indicator for the construction industry is the Repair/Remodeling Index. In 2009 repair/remodeling expenditures dropped by approximately 8%. With housing prices stabilizing across the nation and now showing a 2.6% growth over last year, repair/remodeling expenditures are again expected to rise. At the time of this writing, our forecasts indicate home repair and remodeling expenditures are projected to grow 6.7% from the current level by the third quarter of 2010.
The main area of concern for the construction market remains the commercial sector.
Commercial construction typically has a 12-month time lag to the developments in the residential construction market. Almost on cue, the commercial construction market entered into its own recession in 2009, with total expenditures down some 20%. Especially hard hit was hospitality (-45%), retail (-32%) office (-28.5%) and manufacturing (-28%) construction. There remains an oversupply of properties in these market segments. With supply far outstripping demand, recovery is not expected until the 3rd quarter of 2011 at best.
But was the gloom real or perceived?
Various companies have reported their 4th quarter earnings and first glance would indicate the market was not so dire.
Home Depot, Lowes and Ace Hardware were down 7.5%, 2.5% and 10%, respectively. Ferguson, the nation’s largest distributor of plumbing products, reported sales being down by 18.6%. Various leading plumbing manufacturers reported sales down between 15% and 20%.
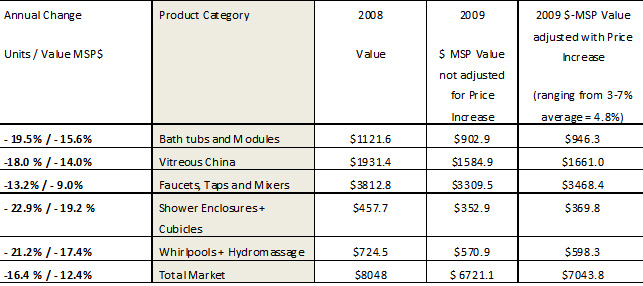
Yes, the market was down significantly in 2009. In fact, BRG research indicates the total U.S. plumbing market was down in units by 16.5%. Across the various product sectors there was an average of 4.8% price increases affected during 2009. This resulted in a $-valuation decrease of the market at Manufacturers Selling Price by 12.4%.
The following table gives an overview of the various product market segments for the US Plumbing Industry:
Gerber and Caroma both showed gains in the market place. Kohler is believed to have maintained their overall market presence, while companies such as American Standard and Toto lost share.
Delta has regained the number one spot in the faucet market, while Moen slipped to number two.
But the biggest winners in the marketplaces were achieved by companies that had gained little attention. In the fixtures market these were companies like Aquadis International, the Foremost Group, Niagara Conservation, the Tynan Plumbing Fixtures Group (supplies Ferguson with private label products) and WDI International.
On the fittings side, the growth of private label offerings was staggering. Private label products now represent the single largest grouping within the faucet market.
But as has been illustrated, manufacturers have started to rebuild. Production increases started around March 2009 and have showed month over month consecutive gains. Since approximately June 2009, distributors starting rebuilding their depleted inventories. Consumer confidence has been on the rise for several months. It suffered a bit of a setback in February, but we believe this may have been weather related. BRG is predicting a 1st quarter boom in new house purchases, especially by first home buyers. We believe the end of the new home buyers’ tax incentive will fuel this boom.
As noted earlier, sales of existing homes were up 7% nationwide compared to last January. We are excited to see the inventory of existing homes start to move in the right direction. At 7.8 months of inventory it is still approximately 30% too high, and will have its effect on the demand for new residential construction, but the market is absorbing the excess inventory and this is good news.
The main area of concern remains the commercial market. Unfortunately, this market will continue to be in the doldrums until the market has weaned itself of its extra capacity. This will take some time.
So let’s ask the question we started this article with:
Is there a recovery out there? The answer is Yes - and we believe it will be a sustainable recovery.
BRG believes the recovery has started. All of the key economic indicators are pointing in the right direction. We believe both new residential construction as well as repair/remodeling will show strong growth in 2010 and will continue for the foreseeable future. We think Chairman Ben Bernanke indeed did see something that most of us could not see - a strong factory-driven, government-supported and consumer-backed recovery.
About BRG – BRG is the leading supplier of evidence based market solutions for the building products industry, with a special focus on the kitchen & bath industry. BRG is headquartered in London and has branch offices in Mount Olive (NJ), San Francisco (CA), Beijing, China. BRG works with all of the major suppliers and distributors in the industry. BRG is a specialist in market sizing, market opportunity identification, competitive intelligence, corporate due diligence and international marketing strategies. BRG’s main office in the United States is in Mount Olive, NJ. BRG can be reached at tel. 973-347-5300 or at 862-258-0973.
Real GDP growth by fiscal quarter - source: BRG Consult Inc.
Was Bernanke right in his statement? Did he see things that the general population did not? The answer is yes, and yes with GUSTO!
In 2009 the U.S. economy retracted by 2.5%. However the economy started rebounding in the second quarter of 2009 and leaped into positive territory in the 3rd and 4th quarters of the year. In fact, 4th quarter growth was an exuberant 5.9%. This is the type of growth typically associated with boom year economies.
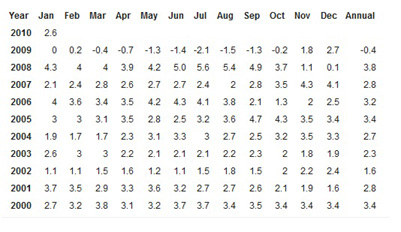
Source: www.usinflationcalculator.com
US Inflation rates by month from 2000 to 2010
As 2009 came to an end, all eyes were focused on consumer spending. With unemployment hovering at 10.2%, the economists were concerned.
“Black Friday,” one of the biggest shopping days during the Christmas season, saw an average 8.6% decline over 2008. The economists sounded the warning bells and ran for the hills!
By the end of December, a Commerce Department report showed spending by individuals fell 1%. December marked the 6th straight month in which consumers cut back on their spending, a decline that accelerated dramatically in the last three months. For the 4th quarter, spending fell a record 8.9% - the worst quarter for spending since the Commerce Department began tracking that statistic in 1947.
Spending for the full year rose just 3.6%, the lowest increase in 47 years.
On another note, by the end of the year distributors had reduced their inventories by 25% compared to the year prior.
Before the New Year set in, we all asked ourselves, “Is there a recovery out there?” A new question now has started to make the rounds: “Is this recovery sustainable?”
At the end of 2009 the U.S. expenditure for construction was down 9.3%. Private residential construction was down 6.4% and private commercial construction was down 19.9%. Public construction, however, went up 2.1% with public housing up 9% over the previous year. This was our stimulus money at work.
The U.S. economy was battered and bruised. At BRG we started to see a clearer picture of how the rebound was shaping up. Companies had started rebuilding. Production for inventory actually started increasing around March 2009 and by December there had been nine consecutive months of inventory buildup. In January, consumer spending on durable goods increased 0.8%.
By February, the momentum increased. Sales of durable goods to inventory were again up - the 11th consecutive month of gains. But as can be seen from the following graph, consumers' short-term outlook took a turn for the worse, with fewer consumers anticipating an improvement in business conditions and the job market over the next six months. The unemployment rate had retracted but still hovered around 9.7%.
Source: National Association of Realtors (NAR)
Even the most robust consumer enthusiasm gets shut down when Mother Nature puts on that kind of deep chill.
But the sun rose again and the snow plows dug out the nation. In early March the U.S. Department of Commerce released encouraging information concerning the U.S. construction market. Building permits were at 621,000 - 4.9% down from the December 2009 rate of 653,000 but 16.9% above the January 2009 estimate of 531,000.
Housing starts also showed encouraging figures. At 591,000 starts, this was 2.8% above the December 2009 number of 575,000 and 21.1% above the January 2009 estimates. According to the National Association of Realtors, sales of existing homes were up 7% nationwide if compared to last January. The largest growth was recorded in the Northeast (+17.1%), followed by the South (+8%), the Midwest (+3.8%) and the West (+2.7%).
Even more exciting, the inventory of existing homes has decreased 9.6% over last January’s level and now represents approximately 7.8 months of inventory. Six months’ worth is considered normal. This is significantly below the 10-month inventory we saw at the peak of the recession in 2008. BRG believes there will be a spike of homes sold in the next few months, especially among first-time home owners as the special tax incentive for first-time home owners will expire in April 2010.
As the following chart clearly shows, existing home sales and the months of supply are both moving in the right direction - another sign that the recovery is underway.
Another key economic indicator for the construction industry is the Repair/Remodeling Index. In 2009 repair/remodeling expenditures dropped by approximately 8%. With housing prices stabilizing across the nation and now showing a 2.6% growth over last year, repair/remodeling expenditures are again expected to rise. At the time of this writing, our forecasts indicate home repair and remodeling expenditures are projected to grow 6.7% from the current level by the third quarter of 2010.
The main area of concern for the construction market remains the commercial sector.
Commercial construction typically has a 12-month time lag to the developments in the residential construction market. Almost on cue, the commercial construction market entered into its own recession in 2009, with total expenditures down some 20%. Especially hard hit was hospitality (-45%), retail (-32%) office (-28.5%) and manufacturing (-28%) construction. There remains an oversupply of properties in these market segments. With supply far outstripping demand, recovery is not expected until the 3rd quarter of 2011 at best.
Source: BRG Consult Inc. Industry interviews
How Did the Plumbing Market Fare in 2009
BRG is in regular contact with the kitchen & bath industry. We speak with manufacturers, distributors and installers throughout the year. During our interviews, we repeatedly heard stories of gloom. Some commented the market was down by 30%!But was the gloom real or perceived?
Various companies have reported their 4th quarter earnings and first glance would indicate the market was not so dire.
Home Depot, Lowes and Ace Hardware were down 7.5%, 2.5% and 10%, respectively. Ferguson, the nation’s largest distributor of plumbing products, reported sales being down by 18.6%. Various leading plumbing manufacturers reported sales down between 15% and 20%.
Yes, the market was down significantly in 2009. In fact, BRG research indicates the total U.S. plumbing market was down in units by 16.5%. Across the various product sectors there was an average of 4.8% price increases affected during 2009. This resulted in a $-valuation decrease of the market at Manufacturers Selling Price by 12.4%.
The following table gives an overview of the various product market segments for the US Plumbing Industry:
Gerber and Caroma both showed gains in the market place. Kohler is believed to have maintained their overall market presence, while companies such as American Standard and Toto lost share.
Delta has regained the number one spot in the faucet market, while Moen slipped to number two.
But the biggest winners in the marketplaces were achieved by companies that had gained little attention. In the fixtures market these were companies like Aquadis International, the Foremost Group, Niagara Conservation, the Tynan Plumbing Fixtures Group (supplies Ferguson with private label products) and WDI International.
On the fittings side, the growth of private label offerings was staggering. Private label products now represent the single largest grouping within the faucet market.
The Plumbing Market's Perfect Storm
The plumbing market experienced the Perfect Storm in 2009. Private expenditures for new residential construction were down 14.3%. Repair/remodeling was down 8% and commercial construction was down 20%. But to compound matters even worse, plumbing wholesalers, home centers, hardware stores and kitchen/bath showrooms pared their inventories. According to our market analysis, distributors reduced their inventories significantly - in some cases inventory purchases were 25% below 2008 levels.But as has been illustrated, manufacturers have started to rebuild. Production increases started around March 2009 and have showed month over month consecutive gains. Since approximately June 2009, distributors starting rebuilding their depleted inventories. Consumer confidence has been on the rise for several months. It suffered a bit of a setback in February, but we believe this may have been weather related. BRG is predicting a 1st quarter boom in new house purchases, especially by first home buyers. We believe the end of the new home buyers’ tax incentive will fuel this boom.
As noted earlier, sales of existing homes were up 7% nationwide compared to last January. We are excited to see the inventory of existing homes start to move in the right direction. At 7.8 months of inventory it is still approximately 30% too high, and will have its effect on the demand for new residential construction, but the market is absorbing the excess inventory and this is good news.
The main area of concern remains the commercial market. Unfortunately, this market will continue to be in the doldrums until the market has weaned itself of its extra capacity. This will take some time.
So let’s ask the question we started this article with:
Is there a recovery out there? The answer is Yes - and we believe it will be a sustainable recovery.
BRG believes the recovery has started. All of the key economic indicators are pointing in the right direction. We believe both new residential construction as well as repair/remodeling will show strong growth in 2010 and will continue for the foreseeable future. We think Chairman Ben Bernanke indeed did see something that most of us could not see - a strong factory-driven, government-supported and consumer-backed recovery.
About BRG – BRG is the leading supplier of evidence based market solutions for the building products industry, with a special focus on the kitchen & bath industry. BRG is headquartered in London and has branch offices in Mount Olive (NJ), San Francisco (CA), Beijing, China. BRG works with all of the major suppliers and distributors in the industry. BRG is a specialist in market sizing, market opportunity identification, competitive intelligence, corporate due diligence and international marketing strategies. BRG’s main office in the United States is in Mount Olive, NJ. BRG can be reached at tel. 973-347-5300 or at 862-258-0973.
Looking for a reprint of this article?
From high-res PDFs to custom plaques, order your copy today!


